Case study: FlatSpikes
Published Feb 28, 2026
Written by
Dmytro K.
Introduction
Would you run your business blindfolded? From the technical point of view, this is basically what you would be doing if you were not to monitor, at least minimally, your app's server system performance.
Are current system resources up to the task? Is scaling necessary, and if so, in what parts of the system? Server application? Database service? Frontend serving machines? How much to scale, and thus, how much will it cost? Maybe you can scale down to save resources and money? If security incident occured, when and where?
All of these questions impact your business performance directly. And they are much easier answered with proper system performance monitoring in place.
Considerations & tasks
Based on the questions and goal above, we can conclude that it would be useful that the measuring software:
Would measure common system performance metrics. Allowing overarching control, as well as resource analysis and management opportunities.
Would be simple to integrate into server systems and app architectures. This cuts time and effort spent on development, which programmers and system administrators could redirect towards development, data analysis, and business critical decisions.
Would be highly configurable. Configurability = flexibility. If we are developing a tool, why not make it useful for a variety of projects, rather than for just one. For some programs and environments it might be useful to only track CPU usage, for others - RAM. Configurability can also save space and simplify analysis.
Would be straightforward and convenient to use. Such tools should be tightly integrated with the environment they will be running in to allow simpler learning and usage.
Solution
The FlatSpikes toolset consists of 3 main tools:
FlatSpikes system: monitoring Linux systems and process performance.
FlatSpikes server: monitoring Node.js server application performance.
FlatSpikes report: generating and displaying reports based on measurements.
Considering requirements stated above, the criteria for picking tools and languages for this project are:
Access to Linux system resources and process information.
Available opportunities for integrations with other languages.
Fast, non-blocking execution.
Thus, the main programming language chosen for the project is Rust.
Rust is a low-level programming language that combines in itself convenient project and package management; access to system resources and processes; precise memory management and minimal memory usage; as well as a unique syntax and concepts that I was curious to try out and explore. This makes it an ideal tool for the project.
For configuration files, the TOML format is chosen for its seamless integration with Rust and simple, readable syntax.
FlatSpikes system
The system tool allows monitoring system and process metrics.
The progem is setup to accept the configuration file as the first command line argument:
let args: Vec<String> = env::args().collect()
let config_path: &String = &args[1];
parse_config(config_paht.into()).await;
Then, the configuration gets parsed according to following data structures:
#[derive(Deserialize, Debug)]
struct Config {
    system: Option<ConfigData>,
    process: Option<Vec<ConfigData>>,
}
#[derive(Default, Deserialize, Debug, Clone)]
struct ConfigData {
    name: String,
    metrics: Vec<String>,
    is_active: bool,
    save_path: PathBuf,
    update_interval: u64,
}
You can see that the Config accepts one system variable and the array of process variables, which allows multiple processes to be monitored at the same time.
And finally, based on the configuration, we launch a separate asynchronous task to monitor each defined metric:
...
loop{
    interval.tick().await;
    monitor_system(&cfg_system, &mut sys, &mut net).await;
}
...
loop{
    interval.tick().await;
    monitor_process(&cfg_process, &mut sys).await;
}
...
Running these tasks asynchronously makes it so they do not block each other, and thus the program will capture correct data at proper interval ticks.
System metrics
The system metrics that are useful to monitor are: CPU load; RAM and SWAP load; Network load; and a disc load.
FlatSpikes server
The server tool is built deliberately as the library that you can use alongside Node.js, because of the specifics of the Node internal architecture.
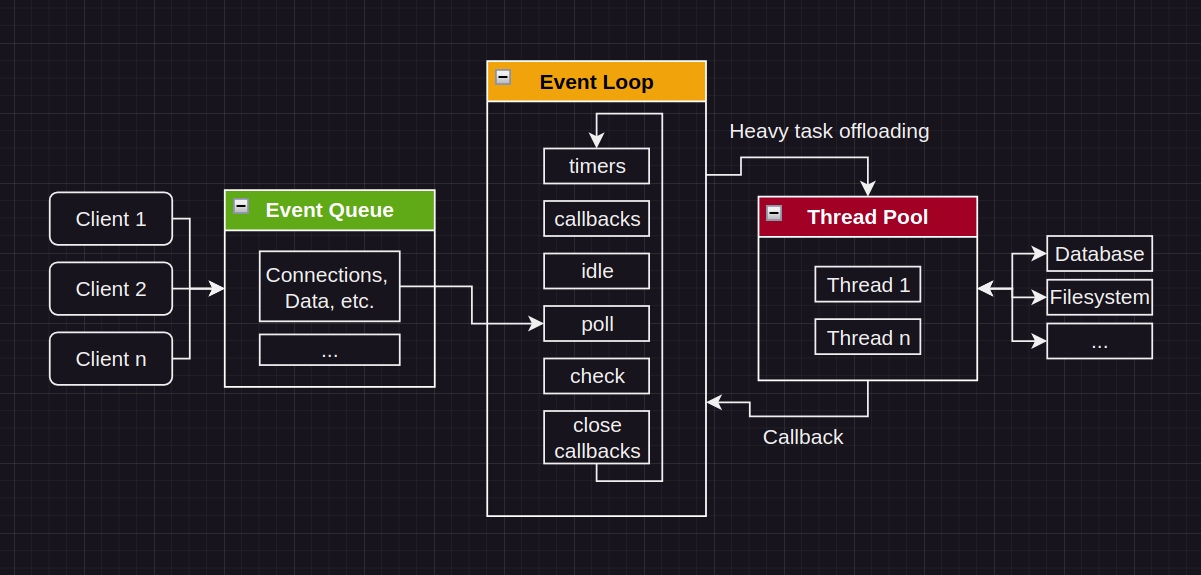
Node.js uses Event-Driven architecture. It runs the main Event Loop and offloads heavier tasks into the Thread Pool.
One of the things that happens during monitoring of the performance of web apps is capturing and saving data. Input/Output operations can be taxing on the system, and thus, if executing directly in the main Event Loop could stall the server app's performance, which would directly negatively impact user experience. Which is unreasonable.
The measuring software should not interfere with the thing it is built to measure.
We can build the tool as a compiled library. By creating our program like this, we move the I/O work into the Thread Pool, allowing the Event Loop to process requests uninterrupted. And because the main server work will not be interrupted, the data that we will capture will more accurately reflect server performance.
The tool operates through the concept of tags. The idea is that the user of the tool would setup set of tags, and then programmatically trigger them in places of measurements.
For example, measuring instruction performance:
monitor_start();
set of instructions;
monitor_end();
You capture the timestamps, and the difference between end and start will show execution time.
For servers, in a similar fashion, it is useful to measure route performance:
server.get("/")
	monitor_start_middleware();
	route business logic;
	server response sent;
	monitor_end_middleware();
Adding one more function you can get information about errors:
server.get("/")
	monitor_start_middleware();
	route business logic;
	server response sent;
	if error {
		monitor_error();
	}
	monitor_end_middleware();
As you can observe, there is a possibility that on a single request there will be multiple different measurements made. How would you distinguish which measurements belong to which requests?
To distinguish sets of consecutive requests the concept of "correlation ID" is used. Each request chain, on its start, gets a unique ID assigned to it, which gets captured alongside performance timestamps. This allows us to "correlate" measurements between each other, which helps us during performance statistics calculations.
Server metrics
The server metrics that are useful to monitor are: number of requests per second; average response time; peak response time; error rate;
FlatSpikes report
This tool is a program that allows generating reports directly in the Linux command line based on the data that other two tools generate. It accepts JSON data arrays from stdin, parses them, calculates reports based on data source type (system, process, or server program), and displays them in provided order.
Using stdin to accept data is the feature that improves this tool's integration with Linux systems, because this for example allows using Linux "pipes" to connect data sources with programs. For example, this allows generating live server performance reports using core Linux commands by routing data generated by other two tools into the report tool.
Possibilities
FlatSpikes helps to handle common system and program performance monitoring tasks as well as analyze generated data.
Configuraiton & Usage
FSSystem:
Launching the program is done with one simple command:
./fs_sys_bin config.tomlThe example of configuration would be:
[system]
name = "system"
# ..., timestamp, cpu, mem, net
metrics = ["..."]
is_active = true
save_path = "./sys_data.json"
update_interval = 1000

[[process]]
name = "node"
# ..., timestamp, time, mem, cpu, disc
metrics = ["mem"]
is_active = true
save_path = "./node_data.json"
update_interval = 1000

[[process]]
name = "redis"
# ..., timestamp, time, mem, cpu, disc
metrics = ["mem"]
is_active = true
save_path = "./redis_data.json"
update_interval = 1000
FSSystem allows developers to setup and configure metrics, update intervals, and data save paths.
FSServer:
First, the server library should be imported and configured programmatically during Node server setup. The most minimal example would be:
const flsp = require("fs_srv.node");

flsp.init({
	tag: {
		save_path: "./tag_data.json",
	},
})

flsp.monitor("tag");
More practically, you can setup the tool to monitor common performance metrics. First - setting up tags and correlation ID:
const server = require("express")();
const correlator = require("express-correlation-id");
const flsp = require("fs_srv.node");

server.use(correlator());

flsp.init({
	req_start: { save_path: "./node_data.json" },
	req_end: { save_path: "./node_data.json" },
	req_error: { save_path: "./node_data.json" },
});

...
Notice that all tags generate dat into the same file.
Next, we can setup Node express middleware for our convenience:
...
const rps_start = (req, res, next) => {
	flsp.monitor("req_start", correlator.getId());
	next;
}
const rps_end = (req, res, next) => {
	flsp.monitor("req_end", correlator.getId());
	next;
}
...
Then, in our routes, we chain our middleware:
...
server.get("/", rps_start, (req, res, next) => {
	...
	res.sendStatus(200);
	next();
}, rps_end);

server.get("/err_route", rps_start, (req, res, next) => {
	...
	if (err){
		flsp.monitor("req_end", correlator.getId(), "ERROR");
		next(err);
		return;
	}
	...
}, rps_end)

server.use((err, req, res, next) => {
	flsp.monitor("req_error", correlator.getId(), "ERROR");
	res.sendStatus(500);
})
...
Notice that when the error occurs we still capture the "req_end" measurement, but instead of continuing executing the route logic, we pass execution, using next(), to the global error handler, where we additionally take the measurement that the error has happened.
Reports
With just a little bit of setup, as shown above, we are now able to get live reports on our full system's performance.
The most comprehensive example is the ability to use the combination of core Linux commands to continuously watch server performance directly in the terminal:
watch -n1 cat "node_data.json | ./fs_report_bin"
On every server request the data file gets updated and streamed directly into the report application.
Conclusions
Performance monitoring is the crucial part of server system maintenance. It can not only give you peace of mind that everything is working properly, but it can also simplify development, scaling, and in some cases even save money on system resources.
FlatSpikes is useful for developers and system administrators that wish to expand opportunities for control and analysis of server system performance. Use it as an inspiration, or directly for your projects, if you like.